Creating High Performance Ionic Applications
This module focuses of various aspects of creating high performance applications with Ionic and Angular. Topics include how the browser rendering process works, using debugging tools to profile and fix performance, reducing bundle sizes, and architecting code to increase performance.
Debugging Memory Issues
How to improve memory usage in your application
PROModule Outline
- Source Code & Resources PRO
- Lesson 1: Introduction PUBLIC
- Lesson 2: Understanding Browser Rendering PUBLIC
- Lesson 3: Creating Production Builds PRO
- Lesson 4: Measuring Network Requests PRO
- Lesson 5: Debugging Network Issues PRO
- Lesson 6: Measuring Memory PRO
- Lesson 7: Debugging Memory Issues PRO
- Lesson 8: Measuring Frame Rate PRO
- Lesson 9: Debugging Frame Rate Issues PRO
- Lesson 10: Bundle Size & Lazy Loading PRO
- Lesson 11: Interacting with the DOM Efficiently PRO
- Lesson 12: Perceived Performance PRO
- Lesson 13: Dealing with Large Lists PRO
- Lesson 14: Animation Performance PRO
- Lesson 15: Speeding up Observables & Promises PRO
- Lesson 16: Faster Change Detection with the OnPush Strategy PRO
- Lesson 17: Using Web Workers for Heavy Lifting PRO
- Lesson 18: Conclusion PRO
Lesson Outline
Debugging Memory Usage
A program that can't remember anything is pretty useless. We use memory all the time when we are building applications, from creating a simple variable to creating complex DOM elements. The amount of memory we have to work with in the browser is generally pretty generous, but using too much of it can lead to sluggish application performance or even crashes.
In this lesson, we are going to talk through some concepts related to memory usage, and how to deal with potential problems.
Using the 'Performance' Tab
We have already talked about the Performance tab a bit in the lessons on network requests, and now we are going to dive into another bit of functionality that this tab offers.
In order to debug memory usage using the 'Performance' tab we will be creating recordings just as we did for the network requests. Rather than refreshing the application, we will primarily be:
- Starting a recording
- Triggering a manual garbage collection
- Using the application
- Triggering a manual garbage collection
- Stopping the recording
You will need to make sure that you check the Memory checkbox before starting your recording otherwise you won't get any data about memory usage. It is also a good idea to click the little trash icon at the start and ends of your recordings, this will manually trigger the garbage collection process (more on that in a moment) so that we have a nice baseline to work from at the start of the test.
Once you have made a recording, you should see something like this:
What we are primarily interested in here is the JS Heap (although enabled Nodes may also be relevant in some cases, which will graph the amount of nodes in the DOM). The JS Heap is the portion of memory that JavaScript is using, and this graph shows how that memory is being allocated (and released). The graph trending upwards means more memory is being used.
In an ideal situation we should be using memory, and then that memory should be freed once we are done. That is not always the case though, and in just a moment we are going to talk through identifying some potential problems.
Garbage Collection
An important concept to understand when dealing with memory is garbage collection. Some languages require that you manually allocate and release memory, but that is not the case with JavaScript. With JavaScript, we can use memory as we please and for the most part we don't have to worry about releasing the memory because the garbage collection will take care of it for us.
It's kind of like having a messy room mate walking about the house, opening cupboards, turning on devices, leaving trash around, and having someone follow them around and clean up their mess. When building an application, we can mostly just use whatever we like and just have garbage collection clean up after us.
However, we can't be completely care-free about our memory usage. We still can't be reckless with the amount of memory we are using - garbage collection won't clean up anything we are still using, and if we are using lots and lots of memory then the application may become sluggish or crash. We also can't rely entirely on garbage collection to clean up our mess, because it only cleans up stuff that it thinks we aren't using. It's possible to create situations where we are no longer using something, but garbage collection doesn't know that, so it stays hogging up memory forever. This is what you would call a memory leak, where memory is being occupied that is no longer of use and is never released.
Memory Usage Patterns
Seeing a bunch of lines on a graph is pretty useless if we don't know what we are looking for. Just because the memory usage is going up it doesn't necessarily mean there is an issue (using memory is part of creating a useful application). Debugging memory issues can be a challenging task, but there are a few indicators that we can look out for that might indicate problems.
Normal Usage
Let's first take a look at what a "good" pattern for memory usage is. In general, if your application is handling memory well it should reflect somewhat of a sawtooth pattern like this:
Memory usage should rise and fall, and rise and fall. Memory usage will increase as the application is being used, but then garbage collection comes along and cleans up whatever is no longer being used (or we remove things that we are no longer using ourselves) so the memory usage drops. The important part is that when the memory usage drops again it should go back down to the same or similiar level to where it was before (unless you have intentionally created something that will stay in memory like additional DOM nodes or variables).
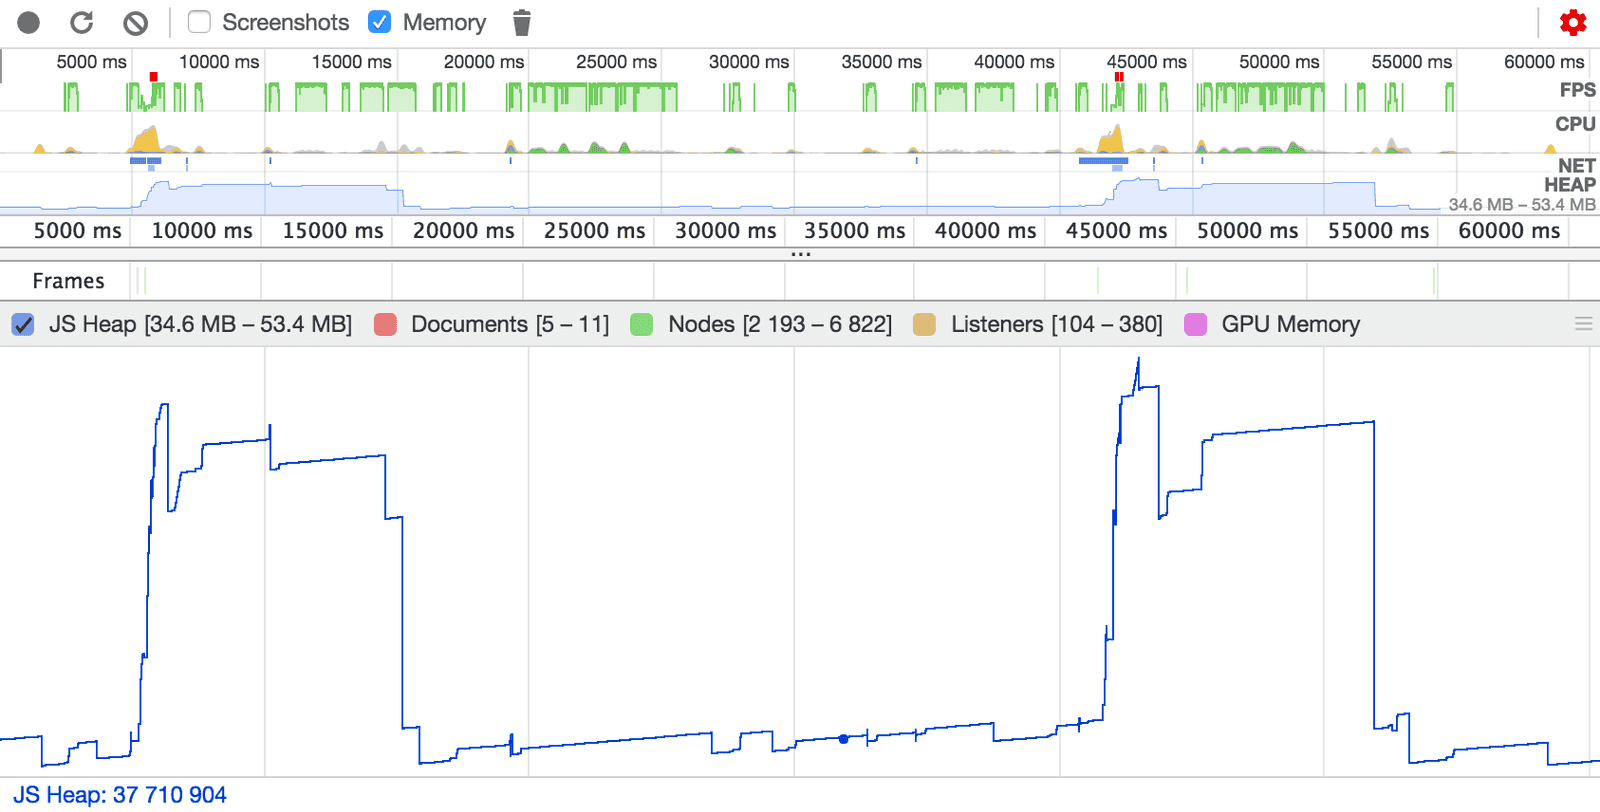
Here's an example from an Ionic application:
The pattern does not exactly match the sawtooth pattern (which is why I have chosen this one), however, the pattern here does still follow the spirit of the saw tooth pattern. There are big spikes here and that's because the page I accessed in my test displayed a large amount of data. The important part is that the memory that is being used is being freed afterwards - the memory usage drops down to a normal level after the spikes.
Increasing Memory Usage
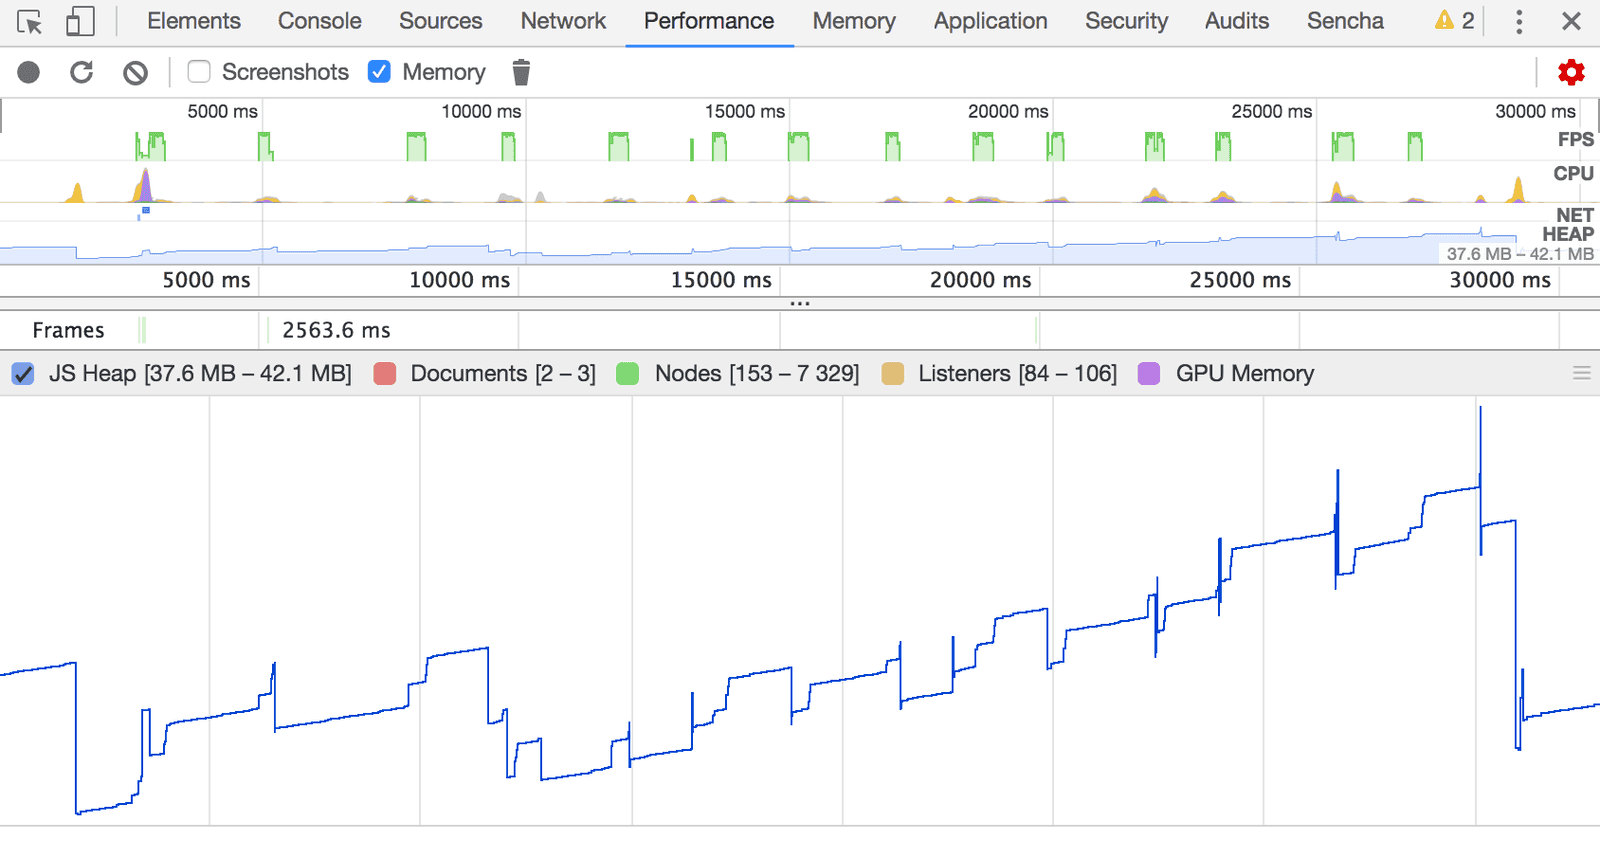
One less than ideal situation is when your application is using an increasing amount of memory. In that case, you might see an upwards trend like this:
Thanks for checking out the preview of this lesson!
You do not have the appropriate membership to view the full lesson. If you would like full access to this module you can view membership options (or log in if you are already have an appropriate membership).


