Creating High Performance Ionic Applications
This module focuses of various aspects of creating high performance applications with Ionic and Angular. Topics include how the browser rendering process works, using debugging tools to profile and fix performance, reducing bundle sizes, and architecting code to increase performance.
Debugging Network Issues
How to improve network requests in your application
PROModule Outline
- Source Code & Resources PRO
- Lesson 1: Introduction PUBLIC
- Lesson 2: Understanding Browser Rendering PUBLIC
- Lesson 3: Creating Production Builds PRO
- Lesson 4: Measuring Network Requests PRO
- Lesson 5: Debugging Network Issues PRO
- Lesson 6: Measuring Memory PRO
- Lesson 7: Debugging Memory Issues PRO
- Lesson 8: Measuring Frame Rate PRO
- Lesson 9: Debugging Frame Rate Issues PRO
- Lesson 10: Bundle Size & Lazy Loading PRO
- Lesson 11: Interacting with the DOM Efficiently PRO
- Lesson 12: Perceived Performance PRO
- Lesson 13: Dealing with Large Lists PRO
- Lesson 14: Animation Performance PRO
- Lesson 15: Speeding up Observables & Promises PRO
- Lesson 16: Faster Change Detection with the OnPush Strategy PRO
- Lesson 17: Using Web Workers for Heavy Lifting PRO
- Lesson 18: Conclusion PRO
Lesson Outline
Debugging Network Requests
In the last lesson, we walked through the basics of using the Network tab to measure network requests. We are going to be recapping some of that in this lesson, and then talking through some steps you might take to improve the impact network requests have on your application.
Network requests triggered in the application include things like POST and GET requests to a server, loading images, loading external files, and so on. However, it is not just external files and data that are loaded through the network, all of your local files (including the JavaScript and CSS files for your application) will be loaded through network requests to the local server.
Typically, the most interesting things with network requests will happen right at the beginning when you first open the application. A lot of activity happens at this point, and it is usually an area of focus because it can affect the time it takes your application to launch.
Using the 'Network' Tab
The Network tab is quite basic, all it does is show us a list of Network requests in the order they were triggered. You will be able to see all of the resources requested over the network, their status (whether the request was successful or not), the size of the resources, and the amount of time that it took to download.
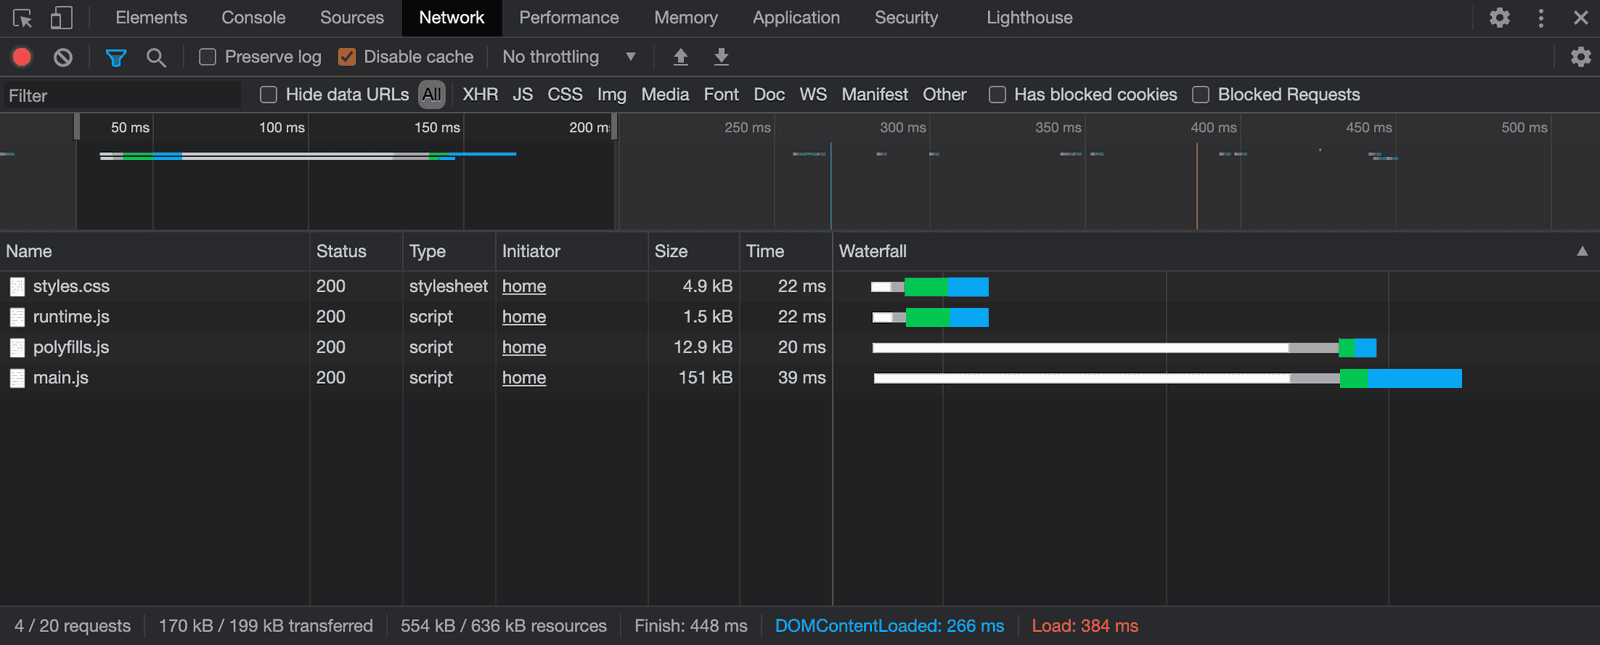
You will also find a graph that contains bars to represent the time it takes for network requests to complete. You can see a break down of the times for these values in the Waterfall section in the bottom right. Each bar has a white, grey, green, and blue section:
- The white portion indicates the time that the request has spent queued (waiting to execute)
- The grey portion indicates that the request is now attempting to execute but has not yet been sent
- The green portion indicates the Time to First Byte (TTFB) which is the time that it takes to begin downloading after the request is sent
- The blue portion represents the time that the resource took to download
You can click on these bars to bring up a highlight of how long each step took. The waterfall section is a good way to visualise how the files in your application are loaded. In the screenshot above, we can see that the styles.css, runtime.js, polyfills.js, and main.js file are all queued at the same time - but the styles.css and runtime.js files are completed more quickly. The main.js file has the largest size at 151kb and this is reflected in the blue bar for that file, which is the longest out of the four (taking 21.11ms to download).
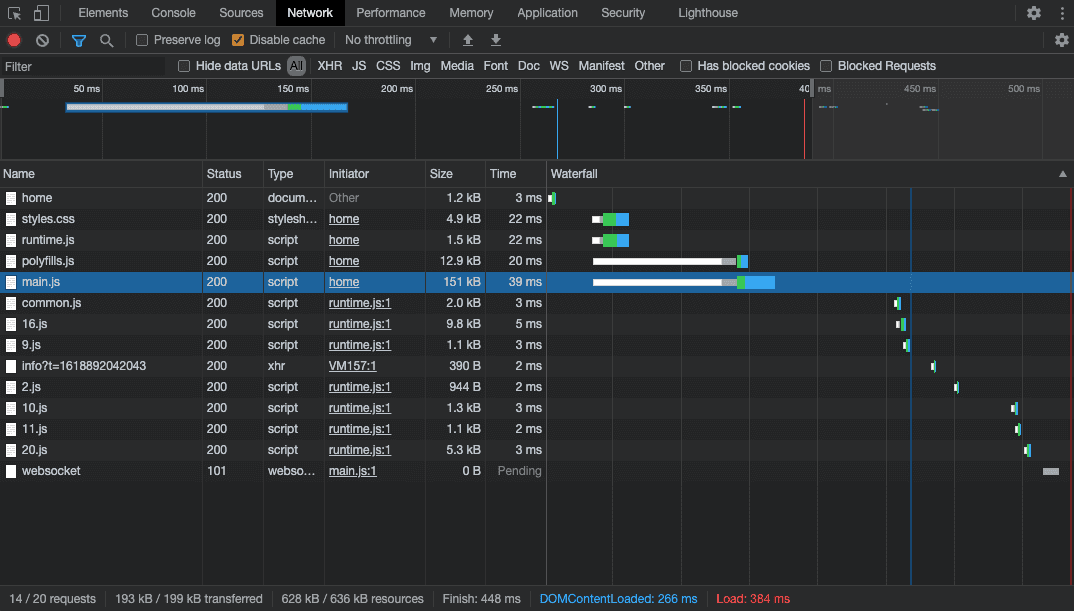
If we select a larger portion of the timeline (you can select a "slice" of the timeline by draging your mouse over the window at the top) we can get a higher level view of what is happening during the load process.
Now we can see that there is actually a request to home to load the document first, and after a short wait the downloads we mentioned above begin. A short while after our four downloads, we can see a bunch of little files being loaded in, there all have names like:
- 16.js
- 10.js
- 11.js
- 20.js
These files begin loading after the main.js file (which is the application itself). This is because the application is using lazy loading. Once the initial application has finished loading, the rest of the "chunks" in our application that we don't need immediately can begin loading in the background (like our pages).
There is nothing suspicious going on here, this is all the kind of thing you would expect to see in a normal application boot. However, it is a good idea to have a look at this tab when your application is loading to see if there is any room for improvement. For example, if we didn't use lazy loading we would have a larger main.js file and we would need to wait for the entire thing to load before the application could be displayed. Perhaps you might find something else in here with a very long bar that is holding something up.
When testing network requests, you will generally open the network tab and then refresh the application to capture the network activity at the beginning of the application. You can also use this to debug network requests as you use the application - just make sure that the network requests are being recorded (the circle in the top left should be red).
NOTE: When debugging using the 'Network' tab you should always have 'Disable Cache' selected. This will force the application to load all of the resources again and not ignore ones that have already been cached by the browser, which will give a more accurate indication of how your application is loading. If your application is using a service worker, you should make sure to either unregister the service worker in the Application tab or do a hard refresh when testing.
Remember to also debug production builds, this is especially relevant for Network requests. There are some files loaded over the network in development builds that just won't exist in a production build.
Throttling & Offline
Another feature that the 'Network' tab offers is throttling and offline mode. You can change the 'No throttling' option in the top right to try out different simulated network types (like slow 2G networks) and see how it affects the performance of your application.
There is also the option of simulating being completely offline - you can either choose the 'Offline' throttling or just check the 'Offline' checkbox. This is useful for testing how your application behaves offline.
Using the 'Performance' Tab
Thanks for checking out the preview of this lesson!
You do not have the appropriate membership to view the full lesson. If you would like full access to this module you can view membership options (or log in if you are already have an appropriate membership).


